



Photo: Dave Allen
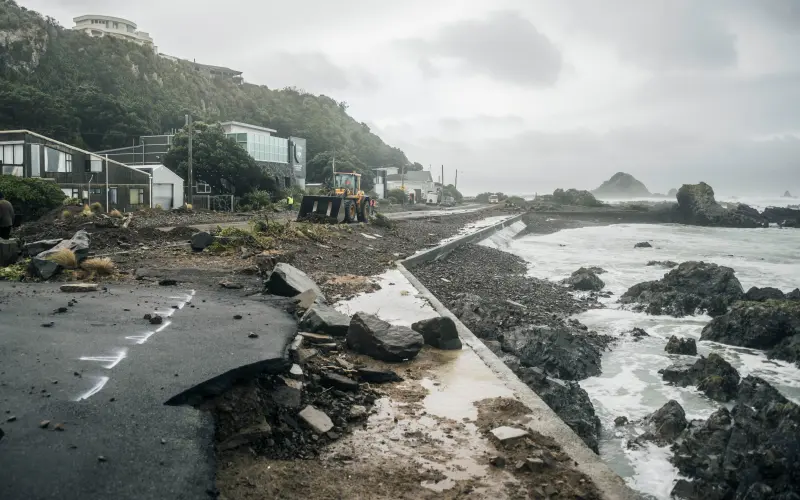
In the first six weeks of this year, eight states of local emergency were declared for severe weather events, matching the total for all of 2025. That was before Wellington’s April storm delivered the heaviest downpours ever recorded in the capital.
NIWA, the Crown Institute dedicated to environmental research, forecasts rainfall will intensify under climate change, with short intense bursts expected to increase the most.
For designers the challenge is to build resilience into homes so they are better placed to handle storms, with less likelihood of water or guttering damage.
Designing guttering to handle the rainfall
Building Code clause E1 Surface water deals with disposal of rainwater from external surfaces, ensuring the water does not enter the building. The first two performance requirements of the clause are:
- Surface water that results from an event having a 10% probability of occurring annually and which is collected or concentrated by buildings or sitework, shall be disposed of in a way that avoids the likelihood of damage or nuisance to other property.
- Surface water, resulting from an event having a 2% probability of occurring annually, shall not enter buildings.
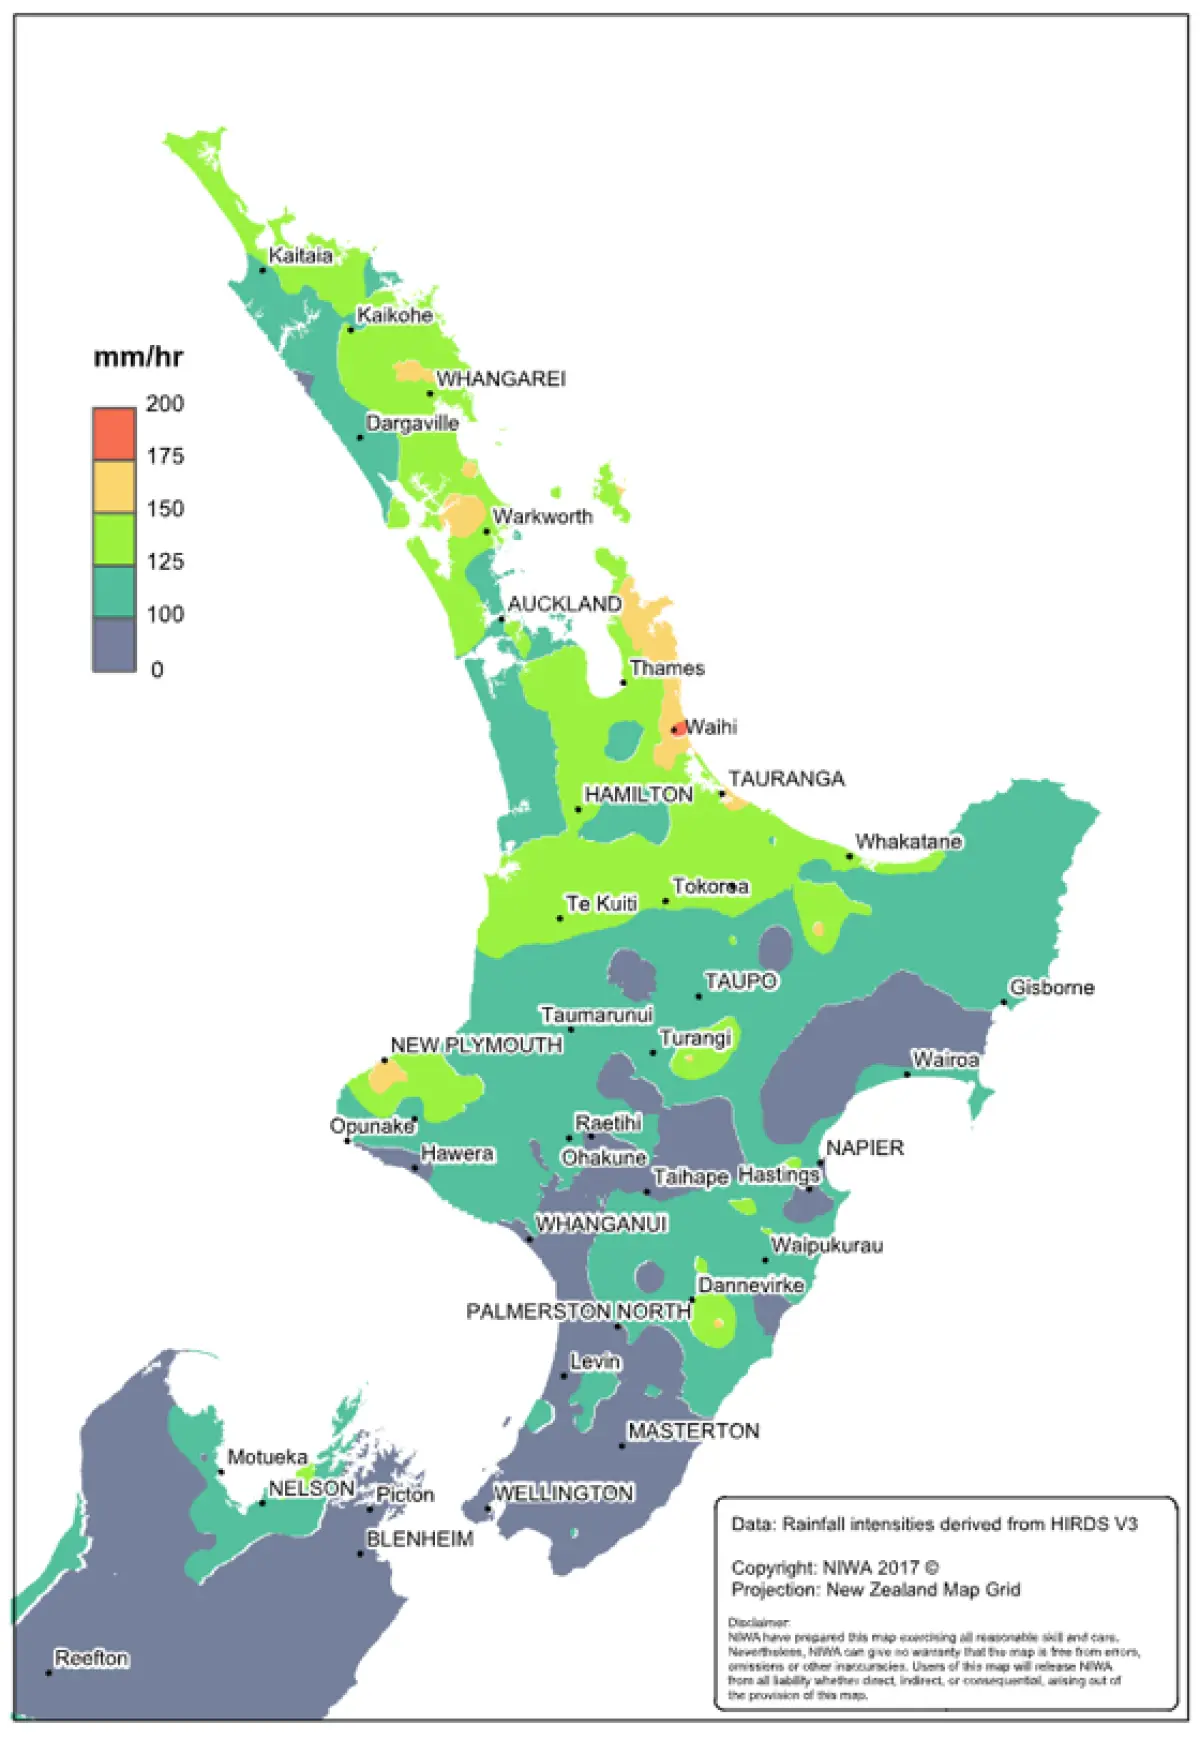
An imporant part of meeting requirements is getting the design of the guttering and rainwater disposal system right. E1/AS1 explains how this can be done, with each section of gutter having a minimum cross section area worked out from Figure 15 or Figure 16 in the Acceptable Solution (5.1.2). These figures are based on a rainfall intensity of 100 mm/hr. Where this figure exceeds 100 mm/hr, the minimum gutter size must be increased as shown in E1/AS1 (5.1.3).
For E1/AS1, calculations of rainfall intensity (explained in 3.2.2) are based on a storm with a 10% probability of occurring annually – the first performance requirement above. In this circumstance, rainfall intensity is likely to be below 100 mm/hr for much of the country.
Yet if you consider the second E1 performance requirement – based on an event with a 2% probability of occurring annually – the historical rainfall intensities are all above 100 mm/hr for Northland, Auckland, Waikato, the Bay of Plenty, Taranaki and the West Coast of the South Island. That is without even making allowance for climate change.
Calculating rainfall intensity
Many sources of figures can be used:
- Historical figures (both Appendix 1 of E1/AS1 and Appendix E of AS/NZS 3500.3:2021 Plumbing and drainage Part 3: Stormwater drainage give figures for 10% AEP and 2% AEP).
- Figures that take account of the anticipated effects of climate change –for example, RCP scenarios 2.6, 4.5, 6.0, or 8.5 shown in Figure 1.
- Custom figures from another source.