


Rocketing house prices might be welcomed by established homeowners, but they have big drawbacks, not just for younger generations but for the entire country. A Cabinet paper from earlier this year made it clear:
‘Unaffordable housing has far-reaching social and economic consequences – children and families living in cars and motels, declining home ownership, health problems from overcrowding, poor productivity, and lower living standards for all New Zealanders. The government spends more than $4 billion each year on accommodation support, which has doubled since 2017.’
The statistics paint the picture:
- Since 2000, average house prices have quadrupled in Auckland and tripled in many other cities.
- While 74% of households owned their own home in 1991, that had fallen to around 66% by 2023 and in one forecast will fall to just 48% by 2048.
- In 2020, New Zealand had the highest housing cost to disposable income ratio in the OECD.
The figures are turning
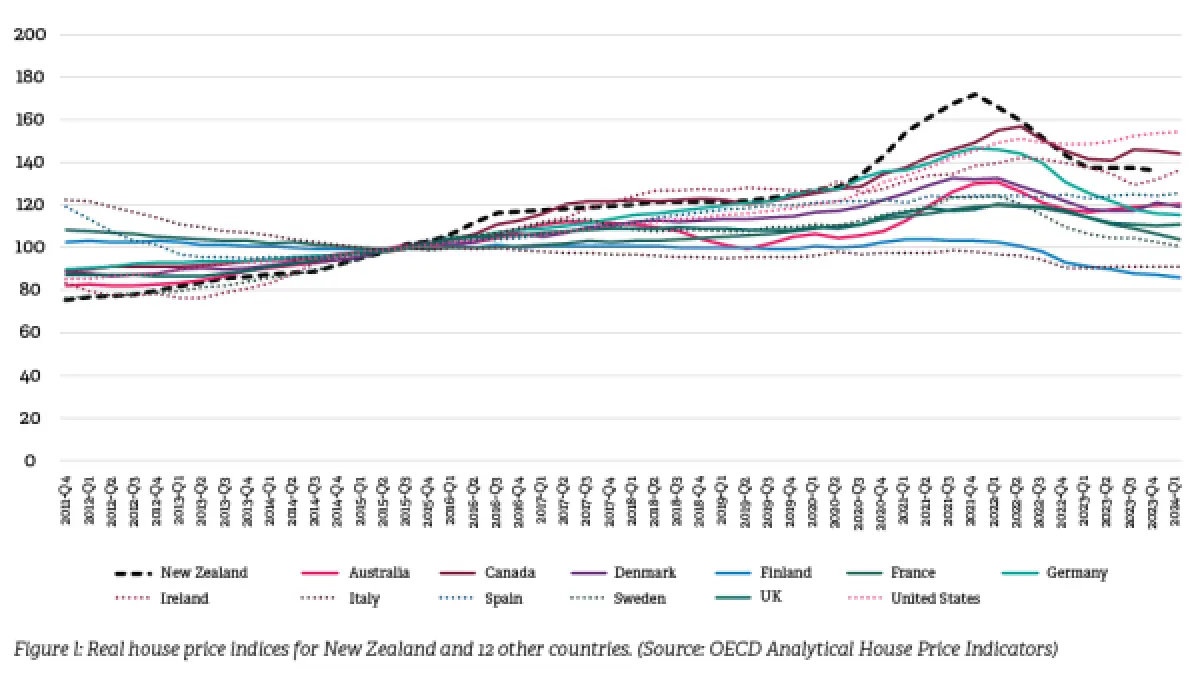
While the big picture data makes for glum reading, if we extend the figures to very recent years, the international comparisons don’t look so bad (Figure 1). Aotearoa New Zealand leapt well clear of the pack in real house price growth in 2021, but we have since fallen by more than most.
The international comparison of house prices to incomes shows a similarly encouraging pattern – a fall since 2021.
Looking at dollar figures, the Real Estate Institute of New Zealand says the national median house price peak of $925,000 in November 2021 fell to $765,000 in August 2024, a drop of $160,000 or 17%.
Why did prices go stratospheric anyway?
A range of factors created the perfect rocket fuel:
- Limited land availability – with constraints on both intensification (building up) and expansion (building out).
- The impact of interest rates – very low interest rates increased the amount home buyers could borrow.
- Land prices have grown substantially. In just one example, section prices increased by 658% in Hamilton City between March 2002 and June 2021.
- Fewer new dwellings being built.
- The homes being built became much bigger.
- Population growth.
- Construction material inflation hit record highs.
- The way our tax system works increases the value of housing relative to other forms of consumption or investment.
These don’t all have an equal impact. A government study looking at house prices found that ‘the main driver of house prices in Aotearoa over the past 20 years has been a global decline in interest rates, in the context of restricted land supply’.
Land and housing supply affect price
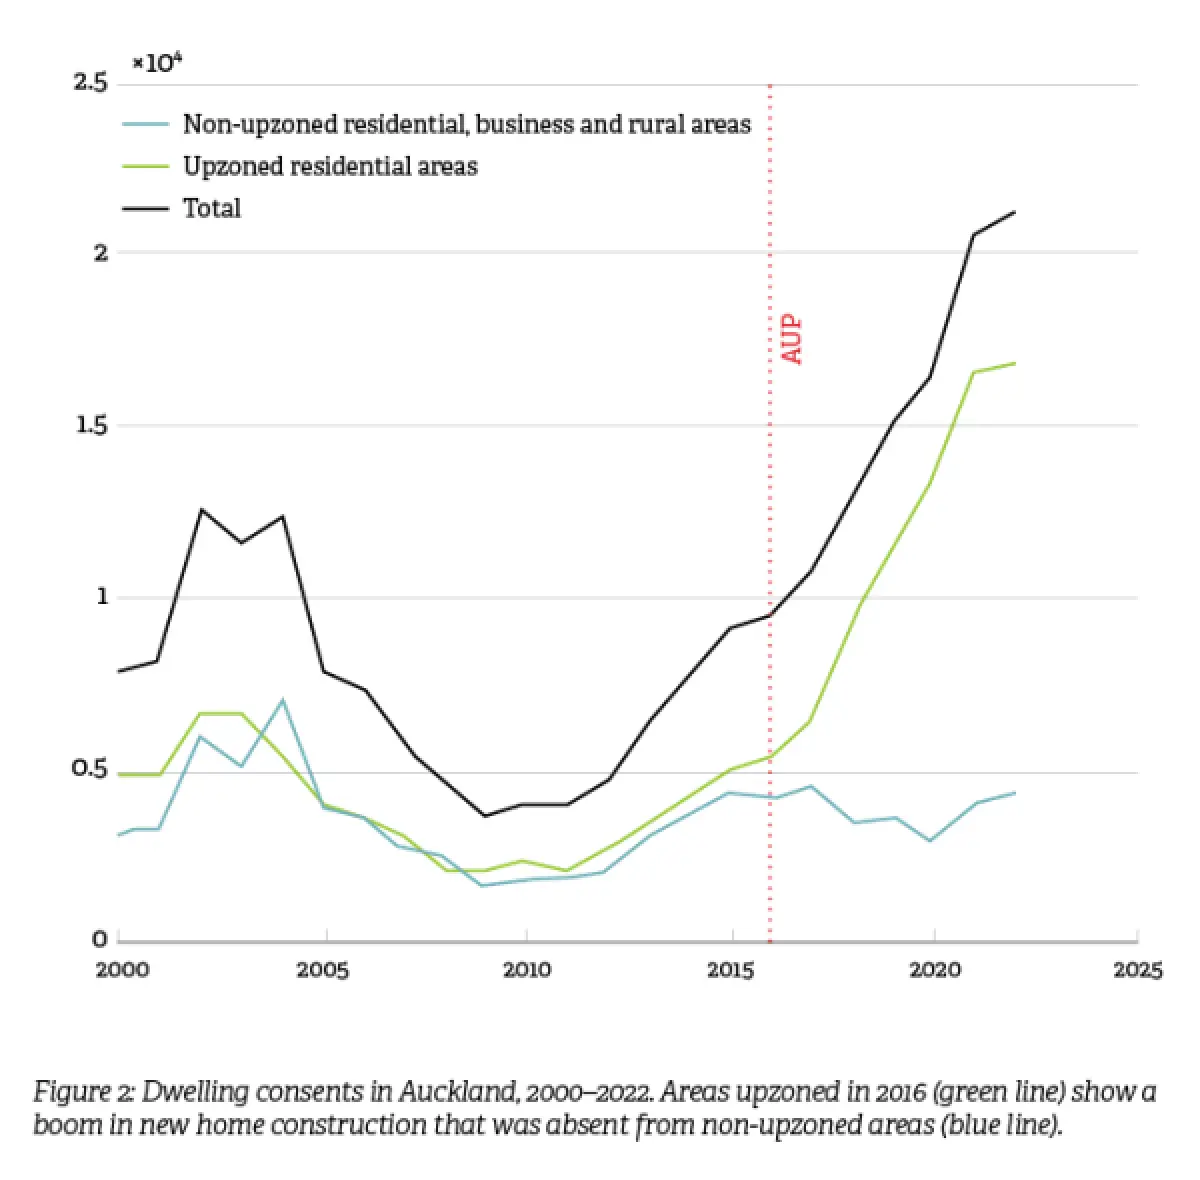
There is evidence that zoning more land for housing tends to increase the supply of new homes, and increasing housing supply tends to reduce price growth in turn. That suggests that the current government push to increase land availability and house construction is likely to have a payoff.
In 2016, Auckland’s Unitary Plan saw an upzoning of a large area of its residential land, precipitating a boom in housing construction (see Figure 2). Around 22,000 new homes consented in the 5 years after 2016 were estimated to be a direct result of the upzoning – the equivalent of 50% more homes.
Research from Auckland University Business School published in 2023 estimates that there was a reduction in dwelling prices of between 23% and 39% compared to what there would have been if the upzoning had not taken place.
Economics consultancy NZIER found that dwellings consented per 1,000 residents were notably higher in Canterbury than in Auckland or Wellington over a long period, even before the earthquakes and the subsequent rebuild, citing, ‘As a result of increased housing availability, house prices and rents in Canterbury have grown less than New Zealand as a whole.’
While increasing land supply is expected to lead to more homes and enhance affordability, it takes a very long time to make a difference, Reserve Bank Economic Advisor John Knowles told Build. ‘The housing stock is so big – over 2 million homes – that it takes a while for the construction of new homes to impact affordability.’
Hamish Fitchett, Senior Economic Analyst at the Reserve Bank, says that the level of uptake from increased supply also depends on the removal of barriers to development.
House size and the rise of the townhouse
Part of the rise in house prices reflects the fact that the median floor area of the homes built almost doubled from 107 m² in 1975 to 200 m² in 2010. This has fallen markedly in recent years. By the end of 2022, the median floor area of all homes consented was 126 m².
The main reason for this is the growth of multi-unit housing and townhouses in particular. ‘The house construction boom we saw recently was really the Auckland townhouse boom,’ CoreLogic Chief Property Economist Kelvin Davidson told Build.
The growth of multi-unit housing is moderating home prices. In a May 2023 article, economics consultancy Infometrics reported that, ‘Over the last year, the average dwelling value for new townhouse consents was $292,000, almost half the $553,000 recorded for stand-alone houses.’
Taken in tandem with the shrinking section size, this difference means that an average new townhouse with land might cost $667,000 compared to about $1,071,000 for an average new stand-alone house with land. ‘If you’re trying to get onto the housing ladder, there’s simply no comparison between the two numbers.’
Population growth
Economics consultancy Motu has investigated population, immigration and house prices and found that population growth puts upwards pressure on house prices.
On average, a 10% increase in local-area population was associated with an increase in house sale prices of 4–6.5%. The researchers found no evidence that a higher share of new (international) immigrants in an area is associated with higher house prices.
Construction inflation
‘One of the issues is the sheer cost of building a new house compared to the price of existing homes,’ says Matthew Curtis, Senior Research Analyst at BRANZ. ‘The differential keeps growing.’
There may be good news here too. CoreLogic’s Cordell Construction Cost Index (CCCI) for residential construction experienced its first recorded drop in the costs to build a new house in at least 12 years, with a 1.1% decrease in the 3 months to June 2024. The peak inflation was 10.4% recorded in the fourth quarter of 2022.
Alternative options for lower-cost homes
While a boost in land supply for housing and changes aimed at reducing construction costs are welcome, for some potential homeowners, it is unlikely they will be enough to get their own home through the traditional route.
There are a growing number of alternative options.
Westpac NZ’s Shared Home Ownership Report prepared by Deloitte and published in July this year found that 152,000 households are eligible for a shared homeownership pathway.
The study report ER81 Enablers and barriers impacting on the development of affordable alternative housing tenures in New Zealand prepared for BRANZ also looks at various affordable alternative housing tenure models in Aotearoa.
BRANZ boosts research around affordability
BRANZ work around affordability is ramping up. In its Investment Priorities Statement 2024, BRANZ identifies affordable housing as one of four main areas of new investment, focusing on:
- developing a definition of housing affordability and how factors that make it up can be compared internationally and tracked over time
- understanding barriers to home affordability and intervention options
- new materials, systems, technologies and practices that will significantly improve housing supply and affordability
- developing low-cost pathways to supply warm, dry and healthy homes
- investigating supply and demand cycles of housing and their impact on vulnerable population groups and industry.