


BRANZ’s Household Energy End-use Project 2 (HEEP2) – a national study of how, when and why people use energy in the home – is collecting vital data on indoor conditions, household energy use and occupant behaviours to help better understand how our homes perform.
A study like this (HEEP1) was last undertaken in Aotearoa in the early 2000s and the data it provided was instrumental in driving policy and industry change for more energy-efficient housing. HEEP2 will provide up-to-date data, contextual information and insights to support ongoing improvements that address energy hardship and support an effective and fair transition to zero carbon.
Defining energy hardship
Energy hardship is a complex multi-faceted issue. The Ministry of Business, Innovation and Employment (MBIE) recently developed a definition and framework of energy wellbeing for Aotearoa.
It defines energy wellbeing as ‘when individuals, households and whānau are able to obtain and afford adequate energy services to support their wellbeing in their home or kāinga’.
The Energy Hardship Expert Panel, set up to support MBIE’s work, identified eight factors as key drivers of energy hardship:
- housing type and quality
- household energy needs
- efficiency of household appliances
- household income
- energy sources
- cost of energy
- where a person lives
- knowledge about energy.
Getting better data on energy affordability
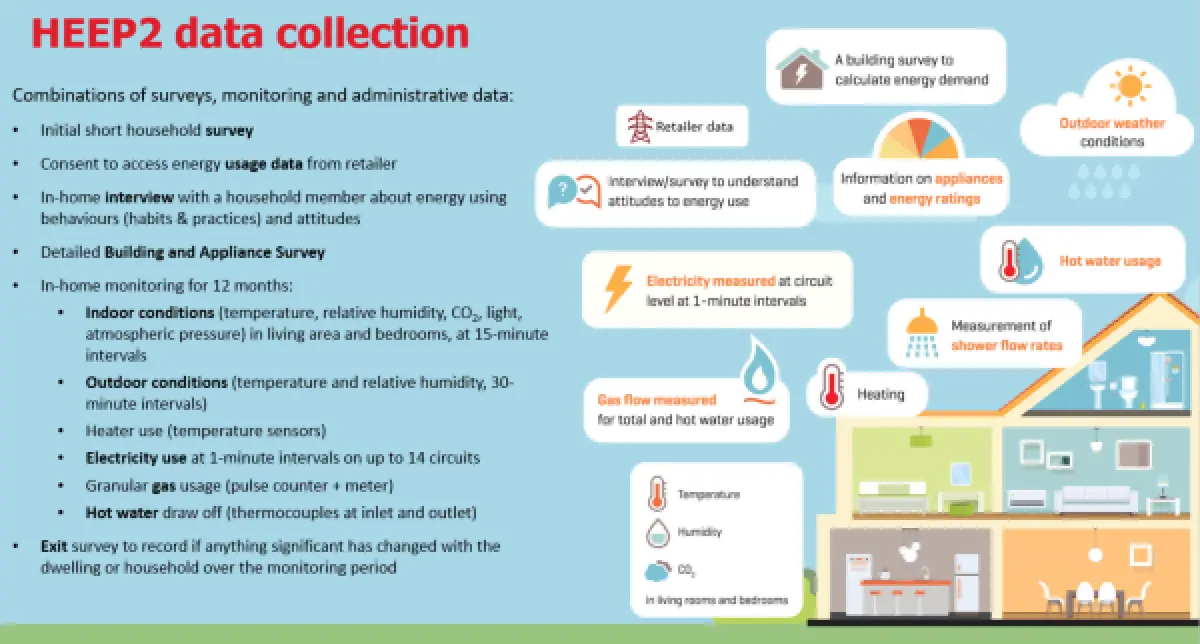
HEEP2 has been monitoring energy use and conditions in hundreds of households throughout the country since August 2022, collecting data on all eight factors. Households were invited to participate in HEEP2 through the Stats NZ Household Economic Survey. All household and dwelling types were eligible to take part. Early analysis shows that participants are mainly owner-occupied households with a tendency towards older age groups – unsurprising for a study of this nature.
The national sample comprises two cohorts. One (numbering 286 households) is surveyed and monitored (see Figure 1), and the other (co-funded by MBIE and numbering 137 households) takes part only in the survey components.
Understanding energy-using behaviours in combination with the data on energy end uses can help identify opportunities to address energy hardship through more efficient and effective use of energy in the home and improvements to our housing.
Indicators of energy hardship
Identifying the best indicators to measure energy hardship is notoriously difficult because we need to be able to distinguish between those who underheat their homes through choice (or habit) and those who simply cannot afford adequate heating.
Relying on expenditure as an indicator of energy hardship does not provide a complete picture and will likely underestimate the scale of the problem. HEEP2 aims to help address some of the data gaps and understanding of energy hardship in Aotearoa, by providing insight into the level of ‘energy services’ delivered. For example, to what extent are householders heating their homes and are they achieving a healthy indoor environment, meeting minimum recommended temperatures of 18-22°C? If not, why not? Is it a building-related issue, inefficient and ineffective appliances, or a behavioural or cost issue?
While that detailed work develops, we can gain some initial insights from the HEEP2 householder interview, which explored a range of issues related to participants’ experiences of energy hardship, including attitudes towards energy use and comfort in the home.
Householders mindful of energy use and cost
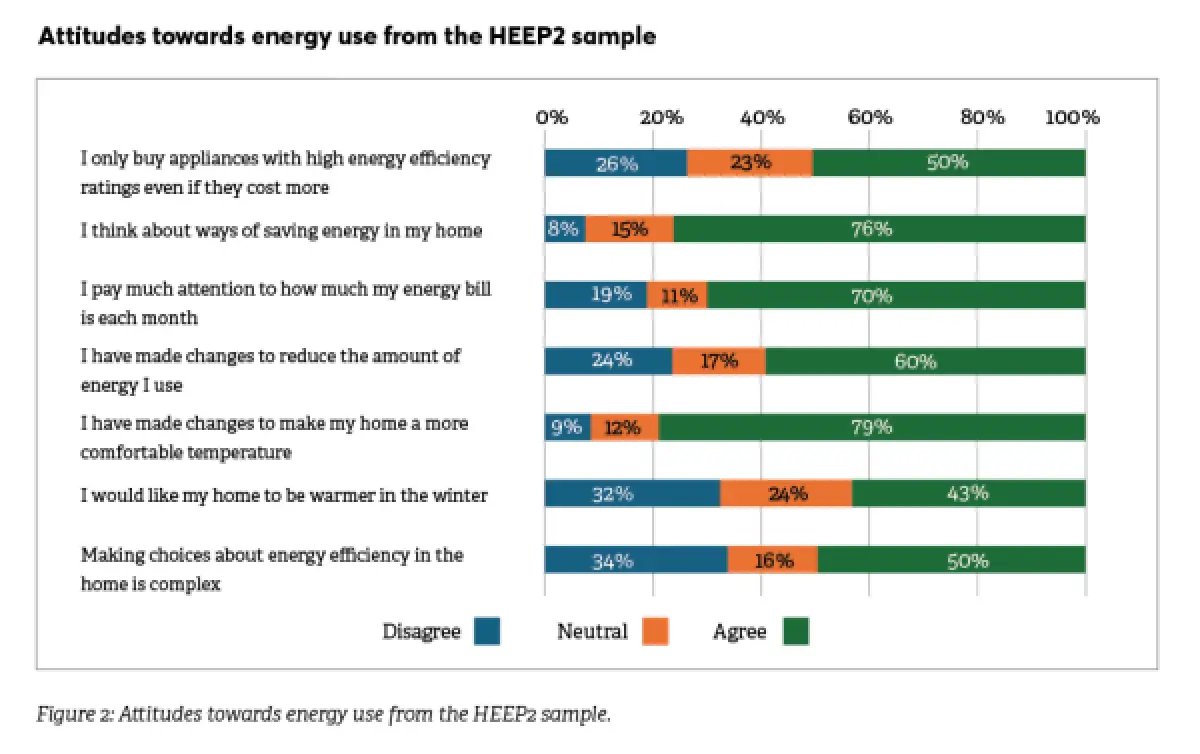
Over three-quarters (76%) of the 423 households surveyed said they think about ways of saving energy in the home and 60% reported making changes to reduce their energy use. For around half (48%), keeping energy costs low was very important, and 5% had gone without heating at some time in the last year because they felt unable to pay for it (see Figure 2).
Energy hardship impacts wellbeing
The inability to afford energy to provide a healthy indoor environment – whether due to income constraints, high energy prices or poorly performing, energy-inefficient homes or appliances – impacts occupant comfort and wellbeing.
Nearly half the HEEP2 sample (48%) considered their home colder than they would like at least some of the time in winter, while for 14%, their home was always or often colder than they would like in winter. This is consistent with the 15% finding from the Stats NZ 2018 General Social Survey (GSS) for owner-occupiers.
As well as impacting occupant health and wellbeing, cold homes are more susceptible to damp and mould. Nearly half (48%) of the HEEP2 sample said their home did get mould, and for 10% of these households, this was always or often larger than an A4 sheet of paper – slightly higher than the 2018 Census figure of 7% for owner-occupiers. Around a third (32%) considered their home damp at least some of time – also slightly higher than the 2018 GSS figure of 27% for owner-occupiers.
Bedrooms underheated and cold
Analysis of data for a subset of 125 HEEP2 houses monitored over winter 2023 shows average temperatures in bedrooms were consistently below the WHO minimum recommended 18°C. For example, Figure 3 shows that the average (median) bedroom temperature was always below 18°C, with 75% of measurements in the critical sleeping period of 11pm–7am below this level.
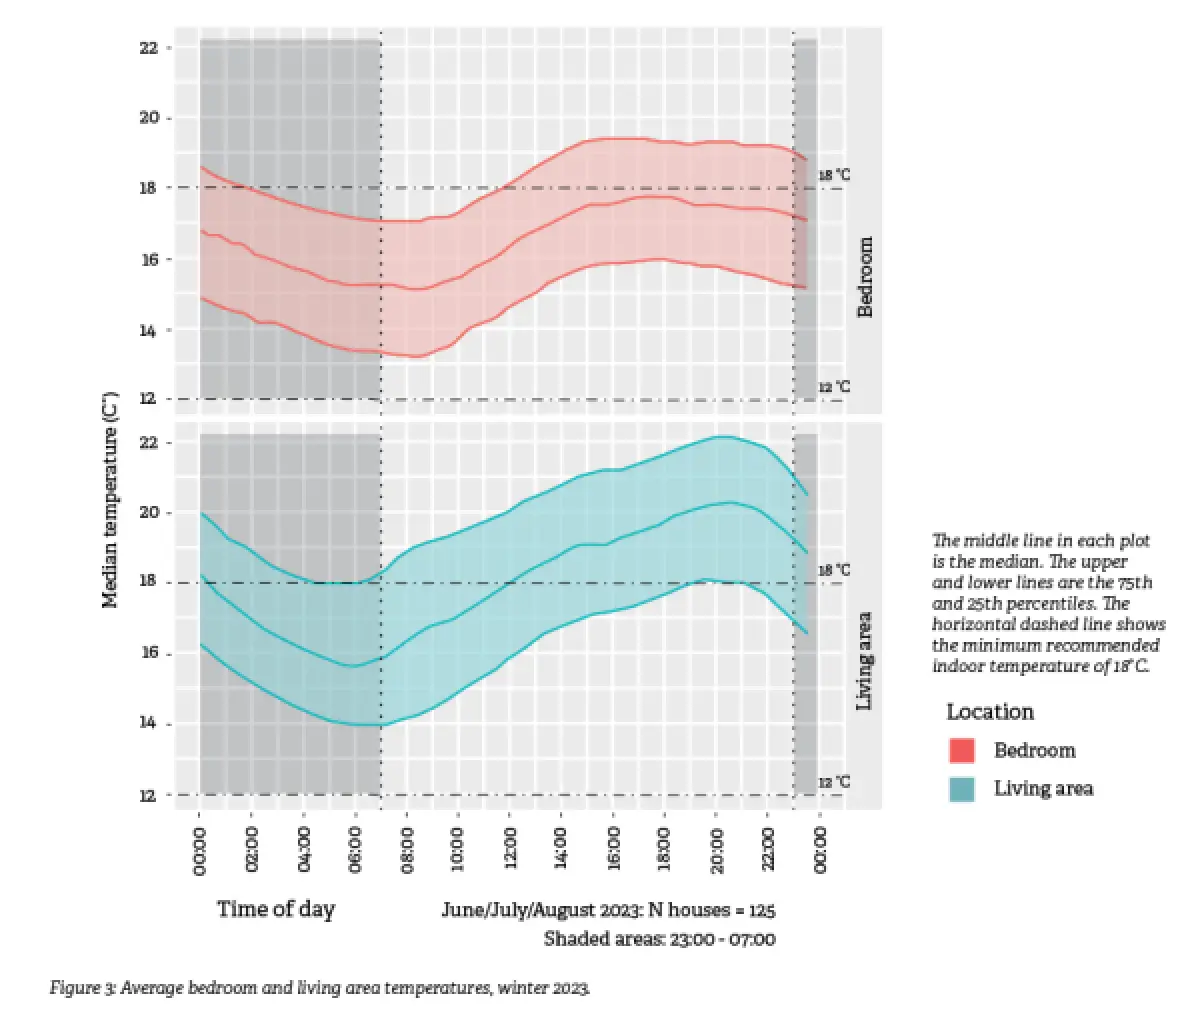
Although extreme values are not shown on the graph, around 8% of the bedroom measurements in this period were below 12°C. Overall, 66% of the houses recorded at least one measurement below 12°C in a bedroom during sleeping hours, while 92% recorded at least one measurement below 18°C in a bedroom in the same period.
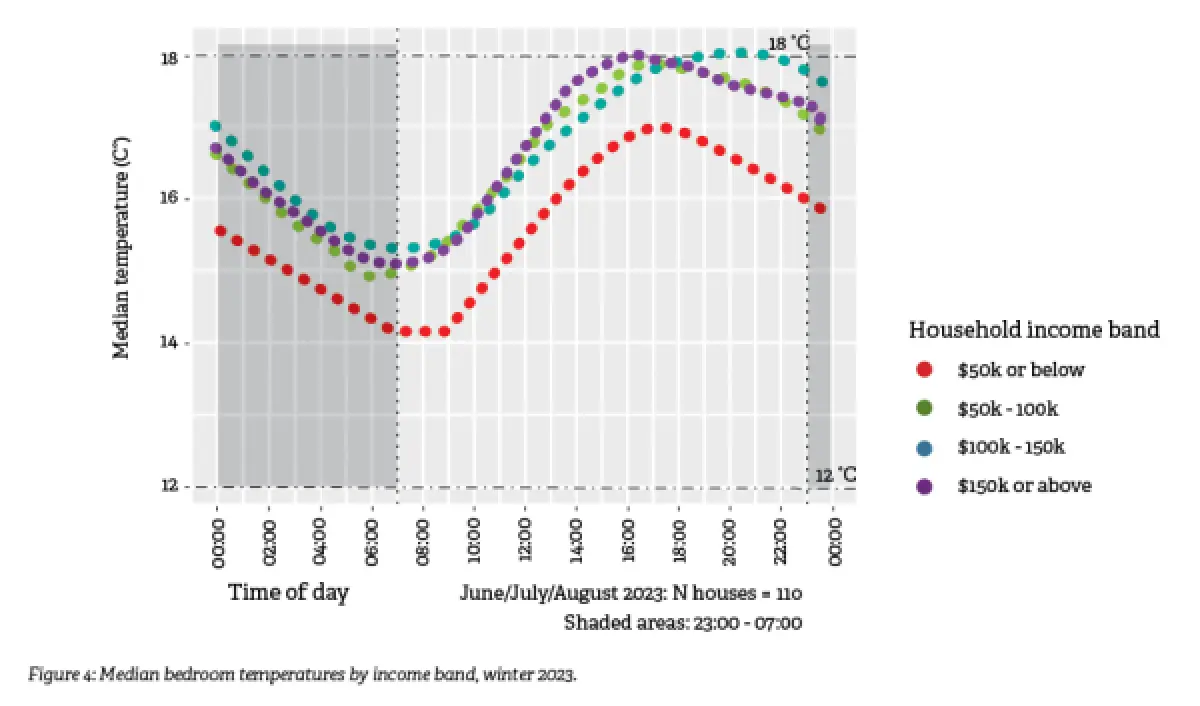
Figure 4 shows median temperatures in bedrooms by annual household income band where we have this information. Although the number of houses in each income band is small (~25–30), the results suggest that those in the $50k or below household income band experienced bedroom temperatures around 1°C lower than the other groups.
Bedroom temperatures dropped to an average (median) of around 14°C by 7am for this income group. There are a range of other potential factors affecting these measurements such as housing quality, the availability and effectiveness of heating, daytime solar heat gains and bedroom occupancy. Unravelling these factors will be part of our future work at BRANZ.
Savings to be made from switching
Energy prices are a key factor in energy hardship. The ability to compare and easily switch between electricity retailers and plans enables consumers to ensure they are on the best tariff for their circumstances.
Consumer NZ reported that users of Powerswitch – its online electricity and gas retailer comparison website – who switched energy providers last year saved an average of $409 per year.
However, navigating and actively participating in the energy retail market can be daunting, complex and inaccessible for some households.
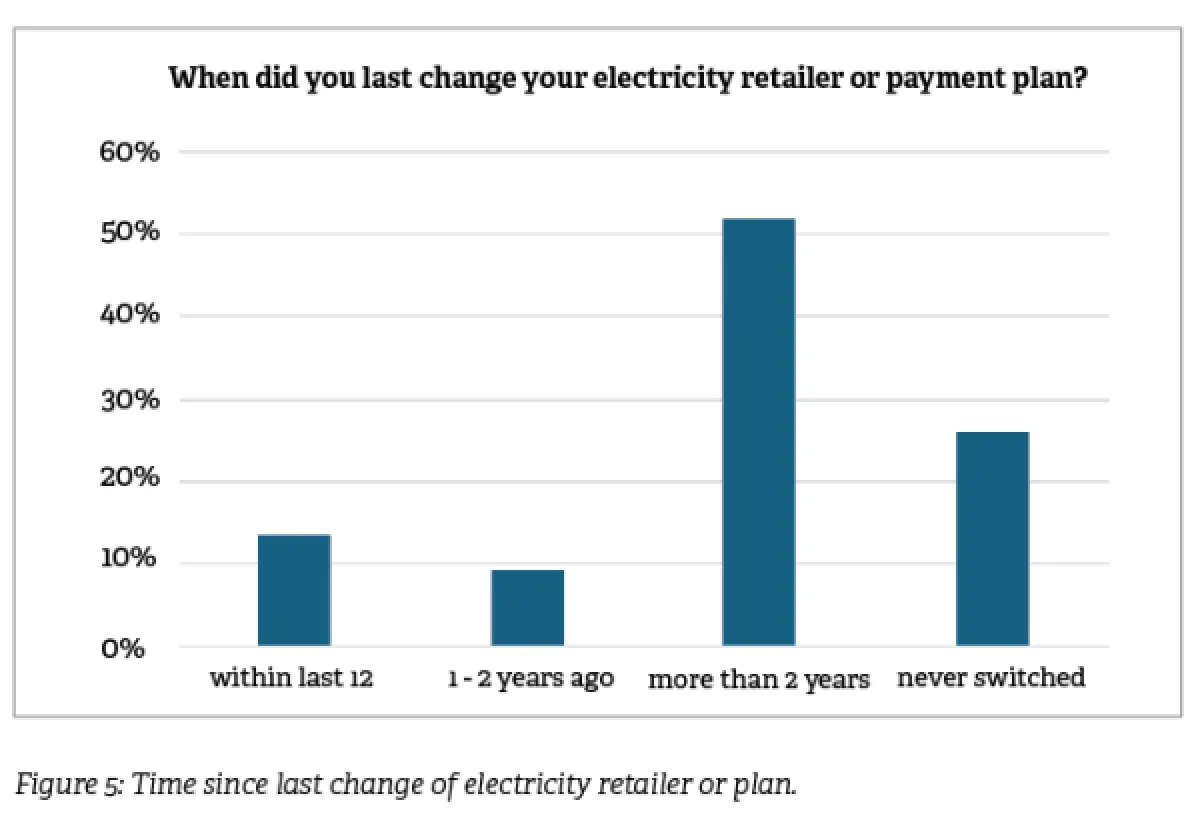
Results from our HEEP2 householder survey showed that around 13% had switched electricity provider or plan within the last 12 months, but for over half the sample (52%), it had been more than 2 years since they’d switched and over a quarter (26%) had never switched (see Figure 5).
Help with winter energy payments
Recognising the cost burden of staying warm during winter, the government introduced the Winter Energy Payment (WEP) as part of its Family Package in 2017 to provide financial assistance to eligible recipients over the winter months.
The WEP is a weekly payment of between $20.46 and $31.82 (around $80–130 a month), paid automatically from 1 May to
1 October to people receiving New Zealand Superannuation, a main benefit or Veteran’s Pension.
While designed to help households with the extra cost of heating during the winter months, the payment is not tied to the energy account but is an income top-up. We asked our HEEP2 households if they received the WEP and, if they did, how this affected energy use in the home. A high proportion (44%) received the WEP, likely reflecting the tendency towards older age groups (retirees) in the sample.
Of those who did receive it, around 16% said this payment did affect how they used energy in winter. Households described heating more, feeling less concerned about turning on the heater and worrying less about being able to pay their energy bill over winter as a result.
Improving housing quality can reduce energy hardship
A well-designed, energy-efficient home will have lower running costs than a poorly insulated home with inefficient appliances. Improving the quality and performance of our existing housing through retrofit and ensuring new homes are built to a high performance of energy efficiency is therefore key to reducing energy hardship in Aotearoa.
The insights provided here from HEEP2 draw on a small component of data collected in the study. As the project continues, we will share more results to support the industry in designing, building and advocating for homes that will ensure all New Zealanders have access to affordable warmth.
Note: Results from indoor temperature measurements are preliminary and based on half the HEEP2 monitored sample only. This analysis will be repeated once all monitoring data is complete.