


During 2023, BRANZ was part of a research team that delivered an innovative project to explore application of a new dynamic approach to embodied carbon footprint calculations in Aotearoa New Zealand.
The research was led by the New Zealand Life Cycle Management Centre at Massey University, with additional input from Scion, École de Technologie Supérieure (Montréal, Canada) and Aalborg University (Aalborg, Denmark). The research was funded by MBIE and the Building Research Levy.
Conventional carbon footprints for buildings, constructions or products are calculated using a static approach. This is the method currently used in international sustainability standards such as EN 15978 (for buildings) and EN 15804 (for building products).
Building carbon footprint and life cycle assessment tools use this method, which is also reflected in sources of data used in these tools such as environmental product declarations.
There are limitations to this static approach, particularly regarding how the timing of impacts is represented. The new dynamic method tested during this research project avoids this limitation.
Inconsistent timeframe in a static approach
Assets like buildings generally have a long service life that extends over many decades. Emissions of greenhouse gases occur at different points in this service life. A static carbon footprint is usually calculated using units of kilograms CO₂e or tonnes CO₂e.
Units of CO₂e convey a contribution to climate change over a fixed time period following emissions of a greenhouse gas. By convention, this is usually 100 years. For buildings, emissions may occur at different stages in the life cycle:
- Products needed for construction are transported to the construction site. These emissions occur in the year a building is constructed (year 0), and therefore the CO₂e impact of these emissions represents the 100 years following year 0.
- Products may be replaced during a 50-year building service life. Emissions arising from manufacture of new products can occur whenever products in the building need replacing. For manufacture of a new product in year 25, the impact (as CO₂e) of these emissions represents the 100 years following year 25.
- A building may be demolished at the end of its service life, for example, in year 50. In this case, the impact (as CO₂e) of the emissions arising from demolition represent 100 years following year 50.
As a result, the calculated impacts (as CO₂e) overlap each other along timelines but do not align to a single timeframe.
Ideally, a methodology would enable us to understand how alternative strategies or design decisions impact on climate change for any period of interest. This could vary from a single year through to longer periods (say 2030–2050), considering:
- when emissions occur and their quantities
- the specific greenhouse gases that are emitted – for example, carbon dioxide, methane and nitrous oxide
- the contribution to climate change of these emissions during the selected time period.
In essence, the dynamic approach provides such a methodology.
Fundamentals of a dynamic approach
A dynamic approach calculates the year-on-year contribution to radiative forcing resulting from emissions of different greenhouse gases at any point in time during the building life cycle.
Radiative forcing in units of W/m² (of the Earth’s surface) reflects the balance between incoming solar energy and outgoing reradiated energy from the Earth. With an accumulation of greenhouse gases in the atmosphere, radiative forcing increases as more energy is retained in the Earth atmosphere system and less is reradiated.
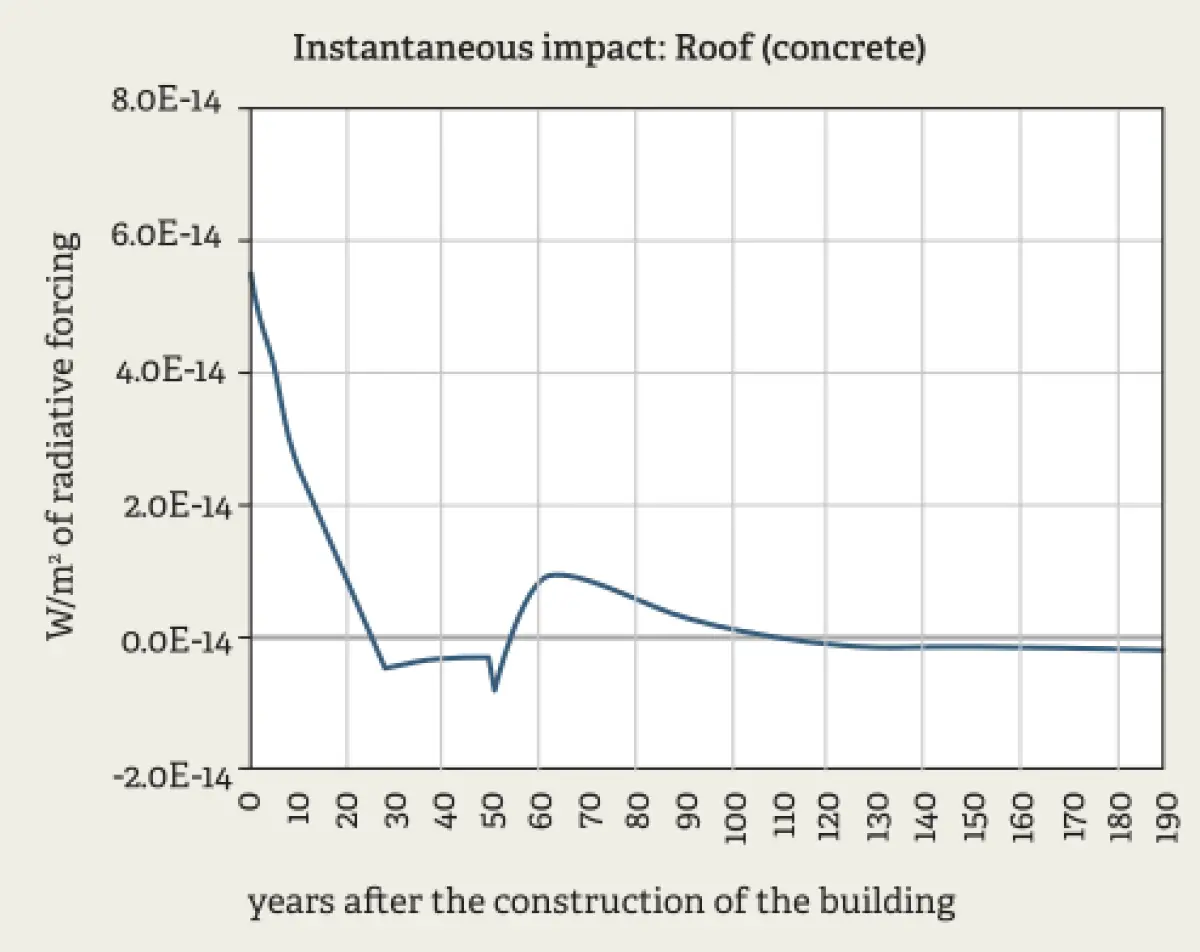
Radiative forcing results can be presented as (a) instantaneous and (b) cumulative, as illustrated in Figure 1 for 1 m² (horizontal ceiling area) of a timber truss roof (15° pitch) with concrete roof tiles. These figures reflect contributions to radiative forcing over a 190-year period from construction.
The instantaneous results show the change in radiative forcing due to greenhouse gas emissions or sequestration of atmospheric carbon dioxide – for example, in sustainably managed New Zealand plantation forests – over time. Figure 1a shows the following:
- Greenhouse gas emissions from combustion of fossil fuels due to manufacture of products, transport and construction activities in year 0 increase radiative forcing.
- Replanting of trees – following harvest in year 0 to make the timber trusses, battens etc. in the roof construction – as part of sustainable forest management means that atmospheric carbon dioxide is sequestered annually during the next forest growth cycle, taken as 28 years. In Figure 1a, this sequestration each year is reflected as the decreasing radiative forcing during years 1–28.
- The further decrease in year 50 is due to recycling of some of the products used in the roof construction. This recycling activity produces secondary products that avoid the need to make as much new primary product, resulting in a net radiative forcing reduction.
- Between years 50 and 110, radiative forcing increases and then tails off. This is due to emissions of methane and carbon dioxide from landfill associated with biodegradation of a proportion of disposed timber.
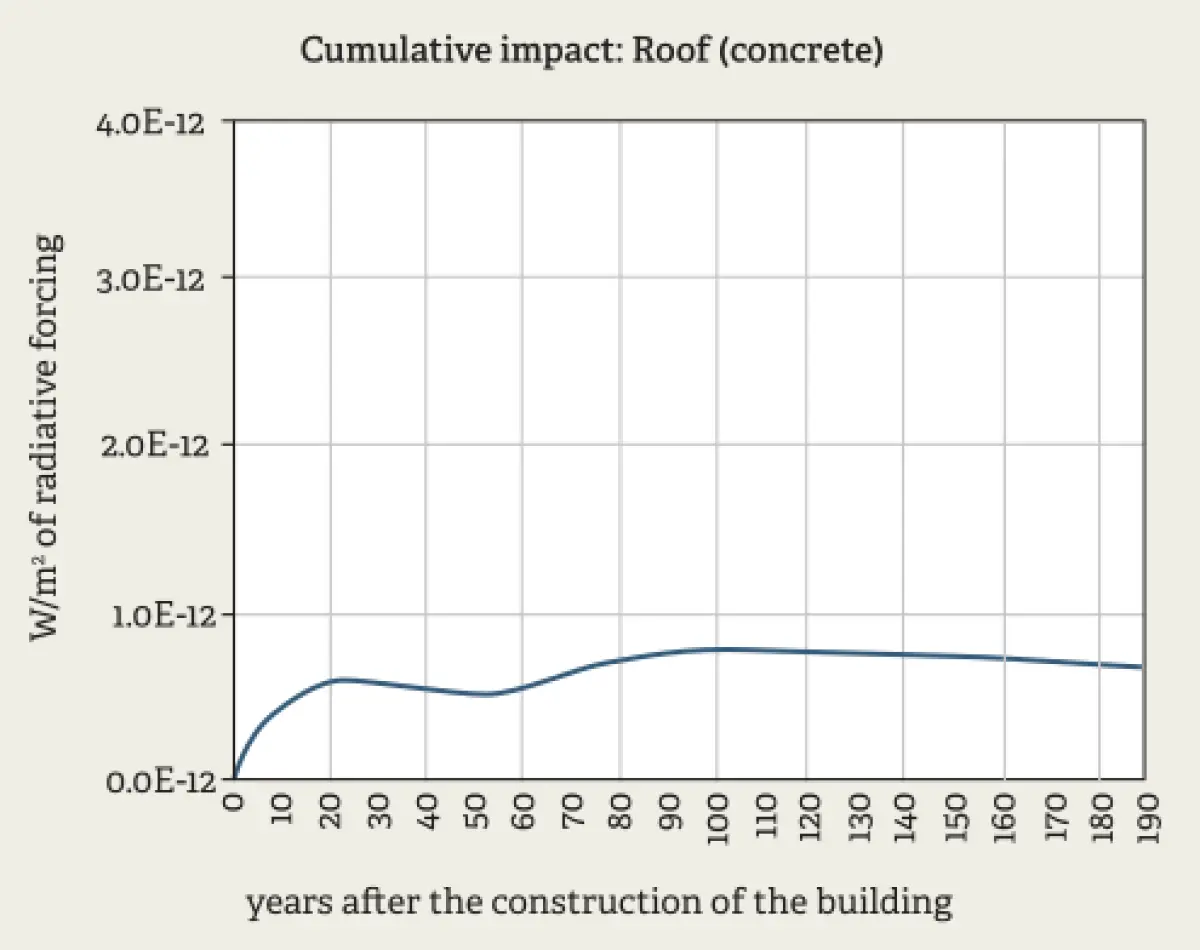
Figure 1b shows the cumulative radiative forcing contribution of the same construction. Early emissions from combustion of fossil fuels due to manufacture of products, transport and construction site activities result in increased atmospheric carbon dioxide that can remain in the atmosphere contributing to radiative forcing for hundreds of years.
By year 28, there is no further net increase due to the cumulative sequestration of atmospheric carbon dioxide in the replanted forest. However, cumulative radiative forcing does increase again after year 50 due to emissions from landfill arising from biodegradation of a proportion of the disposed timber.
When cumulative radiative forcing reaches zero, the construction can be considered as zero carbon – that is, it contributes no increase to radiative forcing. Figure 1b shows that production, use and end of life of this roof example make an ongoing contribution to radiative forcing for at least the next 190 years beyond its construction.
The future
The dynamic approach provides an interesting methodological development to carbon footprinting, which avoids the limitation imposed by a static approach.
However, it is relatively new and not yet reflected in international standards. This recently completed New Zealand-focused research will contribute to a developing body of work internationally and future methodology development.